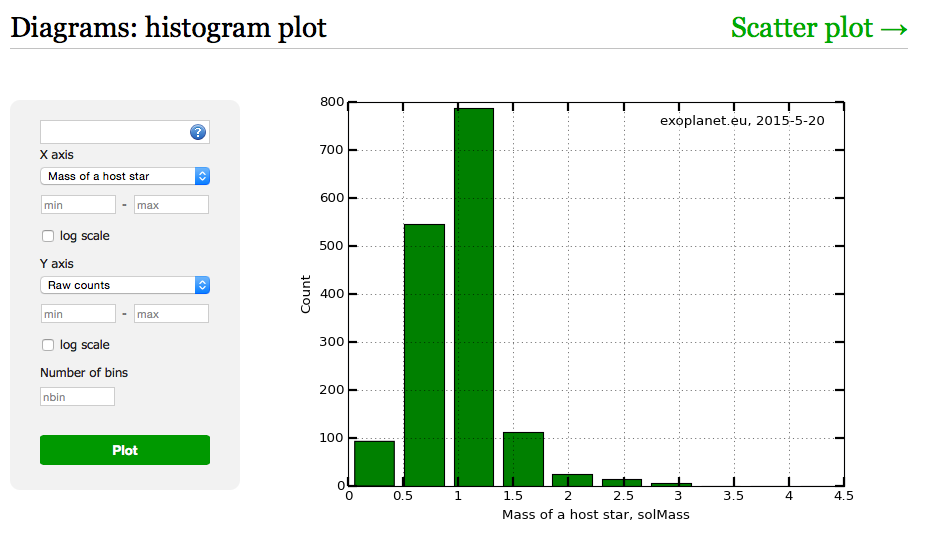
If you go to diagrams, you can choose the x and y data.
With over thirty different sets of data, I am sure one or two Flamsteed members could find something informative.
Bill, that's hours of fun! Cool! And just a sliver of a prospect of a Nobel Prize as well 😉 !!! Thanks for this!
Hi Andy,
I tried
x-axis Age of host star
y-axis Mass of host star
Conclusion:
The older it gets its mass becomes approx. 0.75 solMass!
I'm calling it Bills' Law.
Just stick the medal in the post.
The older it gets its mass becomes approx. 0.75 solMass!
I’m calling it Bills’ Law.
Hmmmm...
Not wishing to rain on your parade, but...
The host star mass ranges from around 0.02 to 4.5 solar masses. From the data, it would appear that the distribution peaks at around 1 solar mass. Surely, this is not a coincidence? It looks like a clear selection effect, as we are searching for exoplanets around sunlike stars.

Sorry, Bill... but the medal may have to wait 😉
ex falso quodlibet
I was following on from Andys' getting a Nobel prize.
But, as the data is selective (they have an upper limit) interpretation needs careful scrutiny.
It would be easy to extrapolate results to an erroneous conclusion.
(Sorry Mike, my fault. I should have made that clear. I stand before you, humbled, in sackcloth and ashes!)
